Graphing Sequences
Let’s draw a number sequence. We can have each number of the sequence represent a point on a two-dimensional graph.
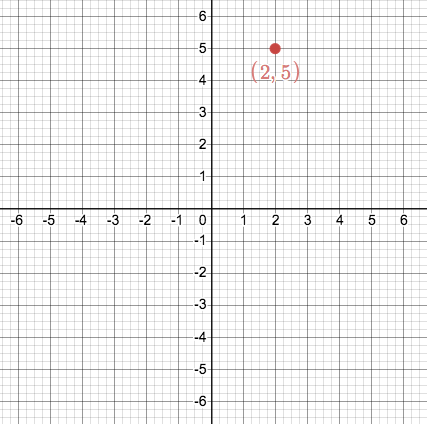
We need two numbers to specify a point on a two-dimensional graph, for example (2, 5).
How do we turn a number sequence into a sequence of pairs of two numbers?
Example: For the Fibonacci sequence, {1,1, 2, 3, 5, 8, 13, 21, 34, 55, 89, …},
an easy way to do so is to let the first number in the pair to be the order number:
{ (1, 1), (2, 1), (3, 2), (4, 3), (5, 5), (6, 8), (7, 13), (8, 21), (9, 34), (10, 55), (11, 89) …. }
We can plot this sequence of pair of numbers on a graphing calculator.
Try plotting the other sequences you have created. You can graph within Google Sheet by clicking on “Insert” and “Chart.”